
Crypto Circle Liying: 7.8 Bitcoin (BTC) and Ethereum (ETH) Latest Market Analysis
Bitcoin's current price is 64000, now firmly at the 64000 mark, it feels like a roller coaster ride back to a safe zone. From a technical perspective, it is in a very classic V-shaped reversal followed by a consolidation recovery period. The EMA7 moving average has crossed above the EMA30, forming a short-term golden cross, indicating that the mid to long-term trend is shifting from bearish to bullish, and the MACD indicator remains bullish. The Bollinger Bands are slightly opening upward, with the middle band rising quickly to provide support. The current price is approaching the upper band resistance around 64600; there will be short-term resistance here, and a surge in volume is needed to break through. Overall, the indicator resonance shows that bulls are dominant, but caution is needed for a pullback after a high.
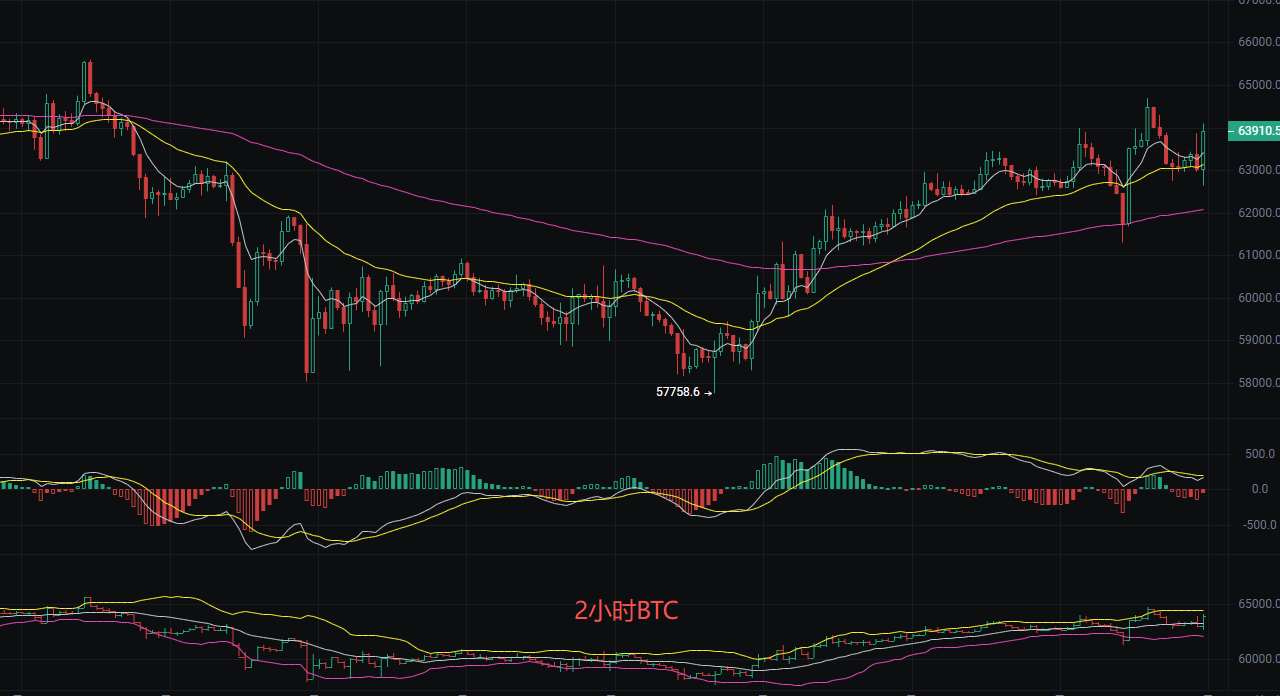
Short-term strategy reference: Focus on long positions on short-term pullbacks, and supplement with long positions on breakthroughs.
For a long position: buy at 63300-62800, stop loss at 62300, target 65000 aiming for 66000.
For a short position: sell at 65500-66000, stop loss at 66500, target 64500 aiming for 64000.
Ethereum
Dear friends, Ethereum was at 1800 before the article was published, previously dropping from 1848 to 1510, leaving many people shaken out of their positions. But the situation is different now; the price has strongly rebounded to around 1800, recovering previous losses and standing above all moving averages. This indicates that market sentiment has shifted from panic to greed, with main funds entering the market to grab shares. The current trend is very clear, representing a standard V-shaped reversal, with the bottom of 1510 confirmed as valid; subsequent pullbacks are buying opportunities. As long as the key support is not broken, this upward trend is likely to continue, and everyone should not fall before dawn; holding onto positions is key. Although the momentum of the MACD indicator has weakened, the trend has not changed. Currently, the price is running closely to the upper band at 1810, with the middle band at 1778 providing strong dynamic support. This kind of movement closely adhering to the upper band is typically a feature of a major upward trend, and as long as the Bollinger Bands are not narrowing, the one-sided upward market is not over.
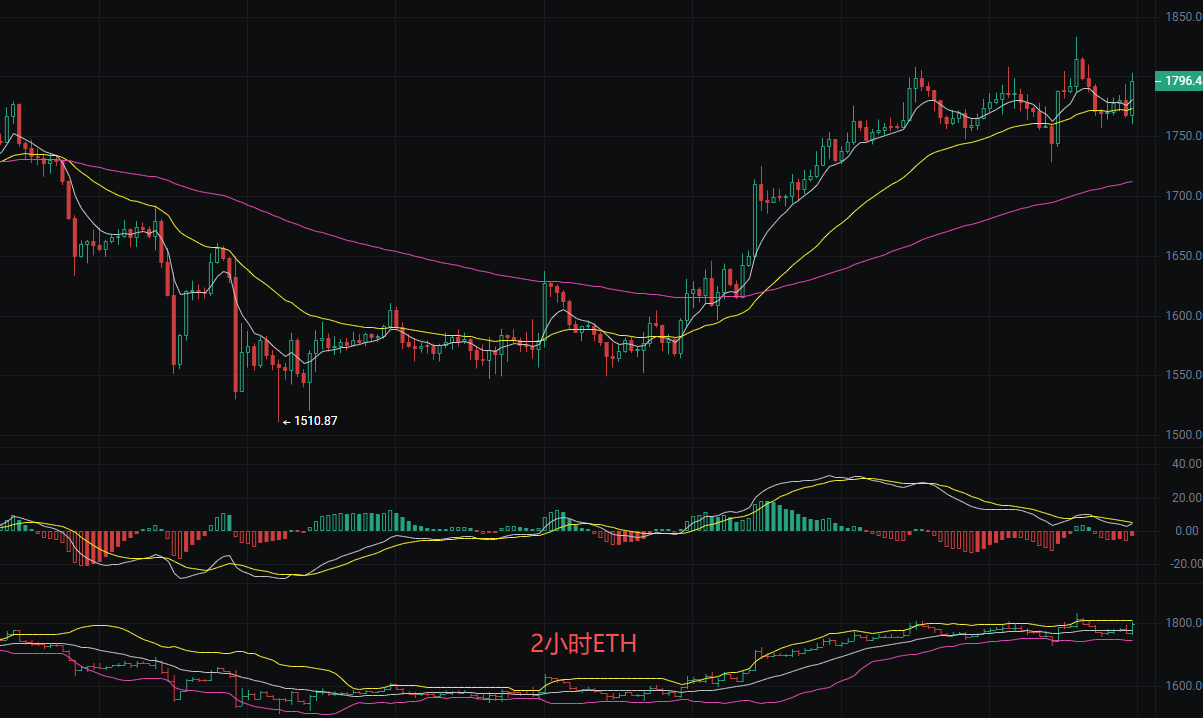
Short-term price reference:
For a long position: buy at 1750, with a defense at 1700, stop loss at 1650, target 1800 aiming for 1850.
For a short position: sell at 1840, with a defense at 1860, stop loss at 1900, target 1780 aiming for 1730.
The above content is exclusively original by Liying, please indicate the source when reprinting! The publication review of the article may have delays, market conditions change rapidly, and the above suggestions are for reference only; risks are borne by the individual.

Warm reminder: The above content is solely created by the author of the public account, advertisements at the end of the article and in the comments section are unrelated to the author; please distinguish carefully, thank you for reading.
Disclaimer: This article represents only the personal views of the author and does not represent the position and views of this platform. This article is for information sharing only and does not constitute any investment advice to anyone. Any disputes between users and authors are unrelated to this platform. If the articles or images on the webpage involve infringement, please provide relevant proof of rights and identity documents and send an email to support@aicoin.com. The relevant staff of this platform will conduct an investigation.